






Table of Contents
- 1.
- 2.
- 3.
- 3.1
- 3.2
- 4.
- 5.
- 6.
- 6.1
Many aspiring data analysts build Power BI portfolio projects but struggle to make their portfolios stand out during hiring. The issue is rarely effort it’s direction. Recruiters evaluating Power BI projects for recruiters are not just looking for attractive visuals; they want Power BI projects that demonstrate business understanding, analytical thinking, and clear communication of insights. A dashboard may look technically impressive, but without context or purpose, it rarely creates a strong hiring impression.
Today, hiring teams increasingly evaluate candidates through portfolios even before interviews. Power BI dashboard portfolio projects act as practical proof of how you approach problems, structure analysis, and present findings for decision-making. Since recruiters often spend only a few minutes reviewing a portfolio, clarity and relevance matter more than complex visuals or advanced features.
The difference between an average portfolio and one that attracts recruiter attention lies in project choice and presentation. Dashboards that highlight meaningful KPIs, business context, and actionable insights immediately signal job readiness. In the sections below, we will see a brief overview of the Power BI projects that impress recruiters instantly, the common mistakes to avoid, and the strategies that help transform a portfolio into a strong hiring asset.
Why Recruiters Evaluate Power BI Projects Before Interviews
Recruiters increasingly rely on portfolios to assess candidates before interviews, especially for data analytics roles where practical skills matter more than theoretical knowledge. Power BI projects in a portfolio provide immediate evidence of how a candidate works with data, communicates insights, and supports decision-making. Well-designed Power BI projects help recruiters quickly understand whether a candidate can translate data into business value.
During initial screening, hiring managers often spend only a few minutes reviewing each portfolio. Instead of analyzing every technical detail, they look for clear signals that indicate professionalism and analytical maturity. Dashboards that present insights logically and tell a coherent story create stronger impressions than visually complex reports without context.
Recruiters typically evaluate projects based on:
- Clarity of the business problem being addressed
- Logical flow of visuals and metrics
- Relevance of KPIs to real business scenarios
- Ease of dashboard navigation
- Ability to explain insights through visuals
A structured Power BI portfolio guide highlights how organized dashboards improve recruiter evaluation by reducing confusion and improving understanding. When dashboards are easy to interpret, recruiters can quickly identify job-ready skills without needing additional explanations.
Ultimately, recruiters are not searching for perfect dashboards but for evidence of thinking and communication. Projects that clearly connect data analysis with business outcomes reduce hiring risk and increase shortlist chances. Understanding this evaluation mindset helps you design Power BI projects strategically rather than focusing only on visual design.
Common Power BI Portfolio Mistakes That Reduce Recruiter Interest
Many candidates invest significant time building dashboards but unknowingly reduce their impact through avoidable mistakes. Recruiters reviewing Power BI portfolio projects are not judging creativity alone; they evaluate clarity, relevance, and business understanding. When dashboards fail to communicate insights effectively, even technically strong work can appear beginner-level.
One common mistake is prioritizing visual design over analytical purpose. Excessive colors, complex charts, or decorative elements often distract from the actual insight. Recruiters prefer dashboards that guide them logically through the data rather than forcing them to interpret visuals on their own.
Frequent portfolio mistakes include:
- Adding too many visuals without a clear narrative
- Using KPIs that lack business context
- Overloading dashboards with filters and interactions
- Missing titles or explanations for charts
- Presenting data without conclusions or recommendations
- Designing dashboards that are difficult to navigate
Another issue is building projects based only on tutorials. While tutorials help learning, portfolios filled with identical dashboards fail to demonstrate independent thinking. Recruiters want to see how candidates adapt datasets, define problems, and extract meaningful insights.
Clarity and simplicity often outperform complexity. A clean dashboard that clearly answers a business question creates a stronger impact than an advanced dashboard that confuses viewers. Avoiding these common mistakes allows your portfolio to communicate professionalism and analytical maturity more effectively.
Power BI Projects That Instantly Demonstrate Job Readiness
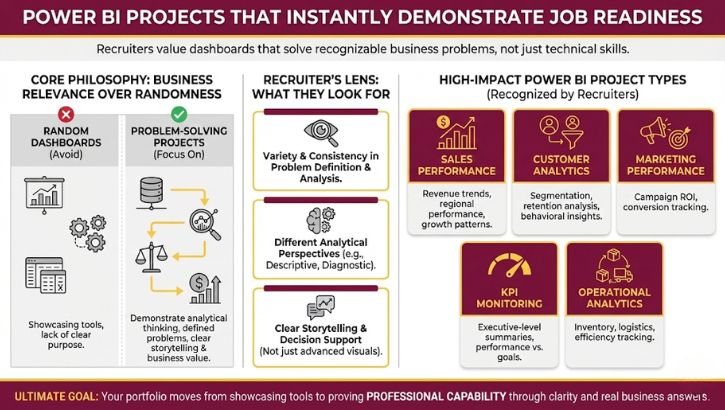
Recruiters are not impressed by dashboards alone - they are impressed by dashboards that solve recognizable business problems. The strongest Power BI portfolio projects mirror real workplace scenarios where data supports decisions, tracks performance, or identifies opportunities. When projects reflect practical use cases, recruiters can immediately visualize how a candidate might contribute in a real role.
Instead of creating random dashboards, focus on projects that demonstrate analytical thinking and business relevance. Recruiters look for variety, but also consistency in how problems are defined, analyzed, and explained. A balanced portfolio typically showcases different analytical perspectives while maintaining clear storytelling.
Project Types Recruiters Recognize Immediately
Certain project categories consistently attract recruiter attention because they align closely with real organizational needs. Reviewing a structured project ideas list can help identify dashboards that demonstrate job readiness rather than practice-level skills.
When reviewing Power BI projects for recruiters, hiring managers typically evaluate projects based on:
High-impact Power BI project types include:
These Power BI dashboard portfolio projects are commonly used in real organizations.
- Sales performance dashboards - tracking revenue trends, regional performance, and growth patterns
- Customer analytics dashboards - segmentation, retention analysis, and behavioral insights
- Marketing performance dashboards - campaign ROI and conversion tracking
- KPI monitoring dashboards - executive-level performance summaries
- Operational analytics dashboards - inventory, logistics, or efficiency tracking
Each project should clearly show the business objective, chosen KPIs, analytical approach, and final insights. Recruiters value clarity and decision support more than advanced visuals. When dashboards help answer real business questions, your portfolio moves from showcasing tools to proving professional capability.
Structuring Power BI Dashboards for Maximum Recruiter Impact
A well-built dashboard is not only about visuals; it is about how information flows from question to insight. Recruiters reviewing portfolios often decide within seconds whether a dashboard feels professional and easy to understand. Structured Power BI portfolio projects help hiring managers quickly grasp the story behind the data without needing detailed explanations.
Effective dashboards follow a logical hierarchy. Important insights should appear first, followed by supporting visuals that allow deeper exploration. When dashboards are organized intentionally, recruiters can interpret results naturally, just as business stakeholders would in a real workplace setting.
Key principles for structuring dashboards include:
- Place high-level KPIs at the top for quick understanding
- Use consistent colors to represent categories or performance levels
- Group related visuals together for logical navigation
- Limit dashboard pages to avoid information overload
- Add short titles that explain what each visual represents
A structured layout also improves credibility because it reflects professional reporting standards used in organizations. Reviewing learner success stories often shows how structured presentation improves portfolio impact and recruiter confidence.
Basic Dashboard vs Recruiter-Ready Dashboard Structure
| Basic Dashboard Approach | Recruiter-Ready Structure | Recruiter Impact |
|---|---|---|
| Random visual placement | Clear visual hierarchy | Faster understanding |
| Too many charts | Focused KPIs first | Better clarity |
| Decorative visuals | Insight-driven visuals | Professional impression |
| No navigation flow | Logical storytelling layout | Higher engagement |
When dashboards guide viewers step by step, recruiters spend less effort interpreting data and more time recognizing analytical capability. Next, we’ll see how to convert Power BI dashboards into strong portfolio proof rather than simple practice projects.
Turning Power BI Projects Into Portfolio Proof Instead of Practice Work
Many dashboards remain at a practice level because they show analysis without explaining impact. Recruiters reviewing Power BI projects for recruiters want to understand not just what was built, but why it matters. Turning a dashboard into portfolio proof requires clear storytelling, business framing, and outcome-focused presentation.
A recruiter should be able to understand your project within a minute. This means every dashboard must communicate three essentials: the problem, the analysis, and the decision supported by the insights. Without these elements, dashboards appear as technical exercises rather than professional work samples.
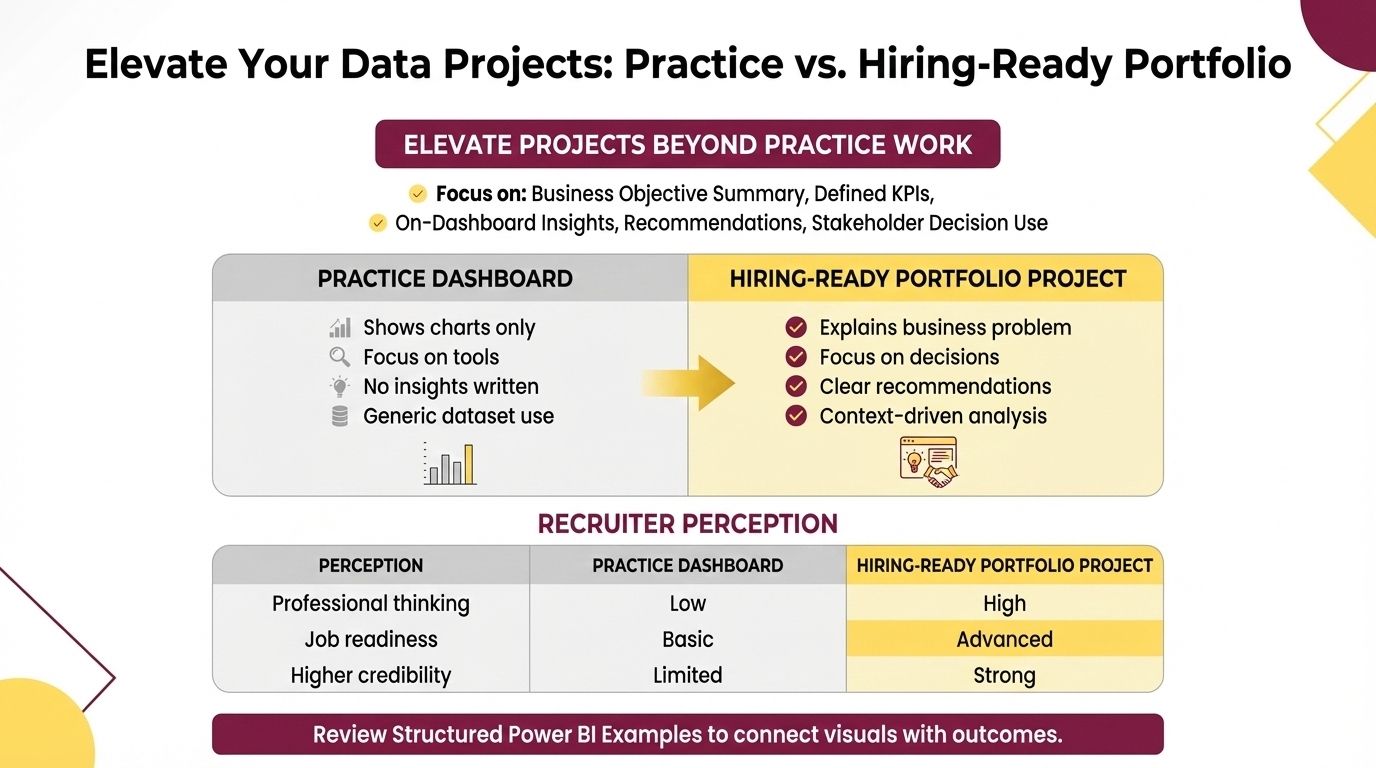
To elevate projects beyond practice work, focus on:
- Writing a short project summary explaining the business objective
- Clearly defining KPIs and why they were chosen
- Adding insight descriptions directly on dashboards
- Including conclusions or recommendations based on findings
- Showing how stakeholders could use the dashboard for decisions
Reviewing structured Power BI examples can help you understand how real-world dashboards connect visuals with outcomes instead of just displaying data.
Practice Dashboard vs Hiring-Ready Portfolio Project
| Practice Dashboard | Hiring-Ready Portfolio Project | Recruiter Perception |
|---|---|---|
| Shows charts only | Explains business problem | Professional thinking |
| Focus on tools | Focus on decisions | Job readiness |
| No insights written | Clear recommendations | Higher credibility |
| Generic dataset use | Context-driven analysis | Real-world relevance |
Using supportive student support resources alongside structured project explanations helps refine presentation and improve overall portfolio clarity, making your dashboards easier for recruiters to evaluate.
Final Optimization Strategy to Make Recruiters Notice Your Power BI Portfolio
After building strong dashboards, the final step is positioning your portfolio so recruiters can quickly discover and evaluate your work. Even well-designed Power BI dashboard portfolio projects may go unnoticed if the overall profile lacks clarity or strategic presentation. Optimization focuses on visibility, consistency, and ease of evaluation.
Recruiters usually begin by scanning your profile overview before opening individual projects. A clear structure helps them understand your specialization and strengths within seconds. Treat your portfolio like a professional showcase where every element supports your personal brand as a data analyst.
Key optimization strategies include:
- Pinning 3–5 best dashboards that demonstrate different business use cases
- Writing a concise profile summary highlighting analytics strengths
- Adding meaningful project descriptions instead of generic titles
- Using consistent naming conventions across dashboards
- Including screenshots or previews for faster understanding
- Updating projects periodically to show continuous learning
Consistency across platforms also improves credibility. When your GitHub, resume, and portfolio communicate the same analytical narrative, recruiters gain confidence in your professional identity. Small improvements in presentation often create a stronger impact than adding new projects.
The goal is to reduce recruiter effort. When your portfolio is easy to navigate and clearly communicates outcomes, hiring managers can quickly recognize your readiness for real analytics roles. In the next section, we’ll summarize the key takeaways and how to move forward with building a recruiter-ready Power BI portfolio.
Final Thoughts
Building an impressive portfolio is not about creating more dashboards but about creating meaningful ones. Well-designed Power BI portfolio projects help recruiters quickly understand how you analyze data, communicate insights, and support business decisions. Throughout this guide, we explored how recruiters evaluate portfolios, the mistakes that reduce impact, and the types of projects that demonstrate real job readiness.
The most effective portfolios focus on clarity, relevance, and storytelling. Structured dashboards, clearly defined KPIs, and actionable insights make it easier for hiring managers to evaluate your work within minutes. When projects explain both the analytical process and the business outcome, they shift perception from learning exercises to professional contributions.
Consistency also plays a major role. Organized dashboards, clear project summaries, and strategic portfolio optimization help build trust and credibility over time. Instead of focusing on advanced visuals alone, prioritizing usability and insight communication creates stronger recruiter engagement.
By applying these principles, your portfolio can evolve into a powerful career asset that highlights both technical ability and analytical thinking. A thoughtful approach to building and presenting Power BI projects not only improves visibility but also increases your chances of standing out during hiring evaluations.
Ready to Make Your Power BI Portfolio Stand Out?
Building recruiter-ready dashboards becomes much easier when you follow a structured learning approach instead of relying on trial and error. The right guidance helps you understand what hiring managers actually expect - from project selection and dashboard storytelling to presenting insights that reflect real business impact. Strong Power BI projects are not just about visuals; they demonstrate analytical thinking, decision support, and professional communication.
If you want to strengthen your portfolio while working on industry-aligned projects, the AI-Powered Data Analytics Certification provides hands-on experience designed around real hiring expectations. With practical projects, structured mentorship, and portfolio-focused learning, you can confidently transform your dashboards into proof of job readiness and make your portfolio more attractive to recruiters.