





Table of Contents
- 1.
- 2.
- 3.
- 4.
- 5.
- 6.
- 7.
- 7.1
- 8.
- 9.
- 10.
- 11.
- 12.
- 13.
- 14.
- 15.
- 16.
The demand for skilled data professionals has increased significantly as businesses rely more on data-driven decision-making. Organizations across industries need analysts who can collect, process, and interpret data to support strategic decisions. Because of this growing demand, many aspiring professionals are enrolling in structured training programs to build analytics skills and start careers in the data field.
A data analytics program that follows a structured learning path helps students build skills gradually. Instead of trying to learn everything at once, learners progress step by step from understanding basic data concepts to working with advanced analytics tools and real-world datasets. Most modern programs introduce tools such as Excel, SQL, Python, and data visualization platforms while also focusing on practical projects that simulate real business scenarios. An overview of a typical data analyst syllabus shows how these tools and concepts are organized to help students build industry-ready skills.
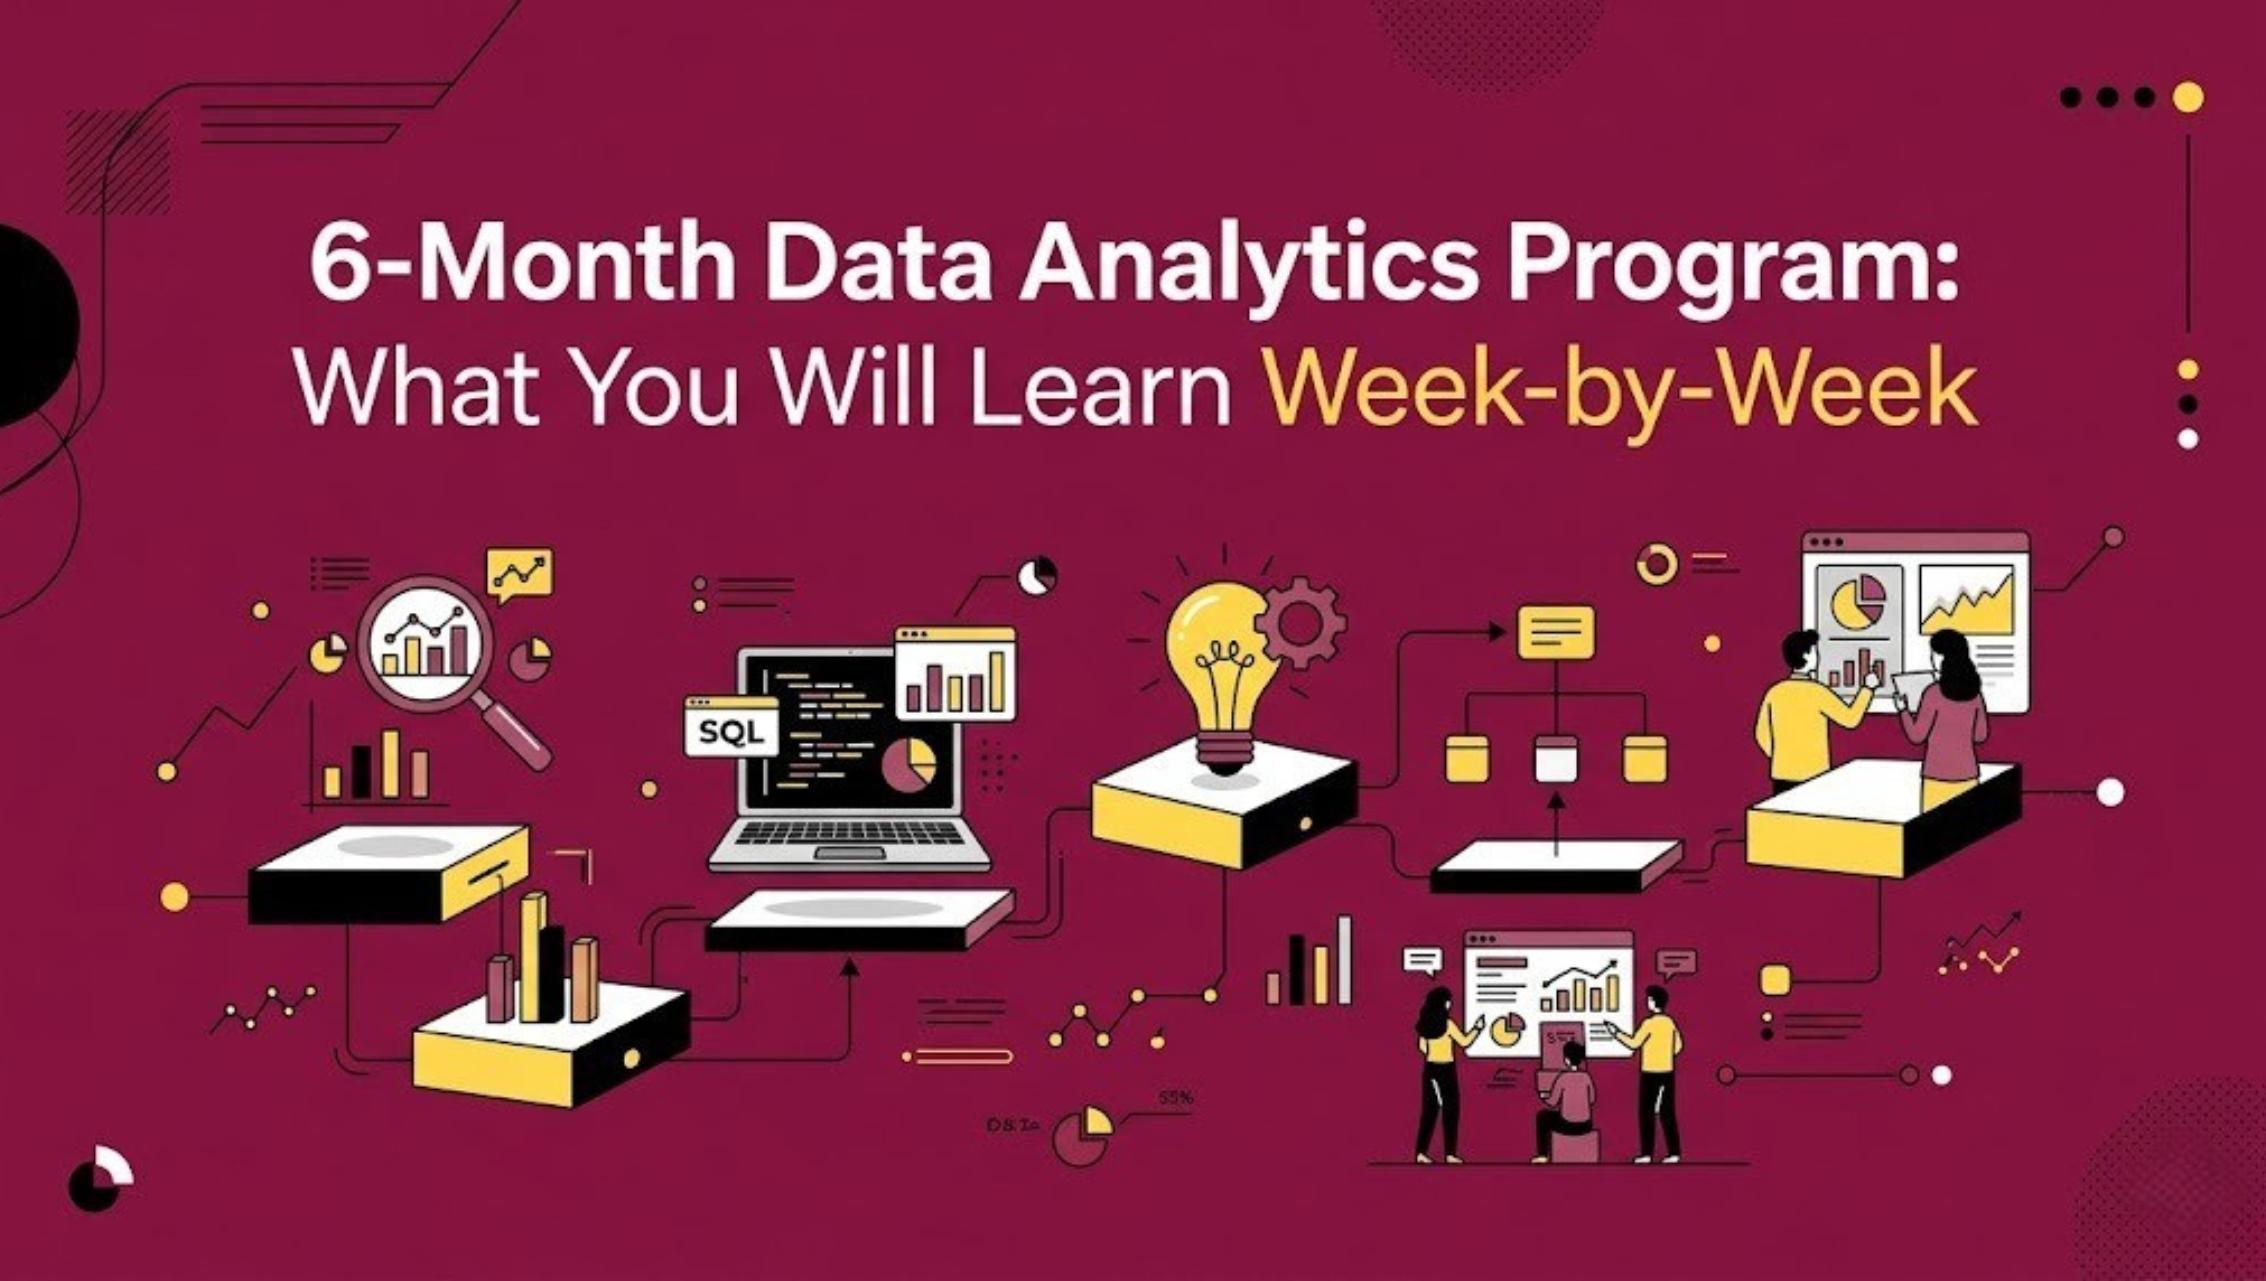
In this guide, we explore what a typical six-month analytics training journey looks like. The following sections break down the learning process month by month, explaining the key topics, tools, and skills students usually gain while progressing through a structured analytics learning roadmap.
What a 6-Month Data Analytics Program Typically Covers
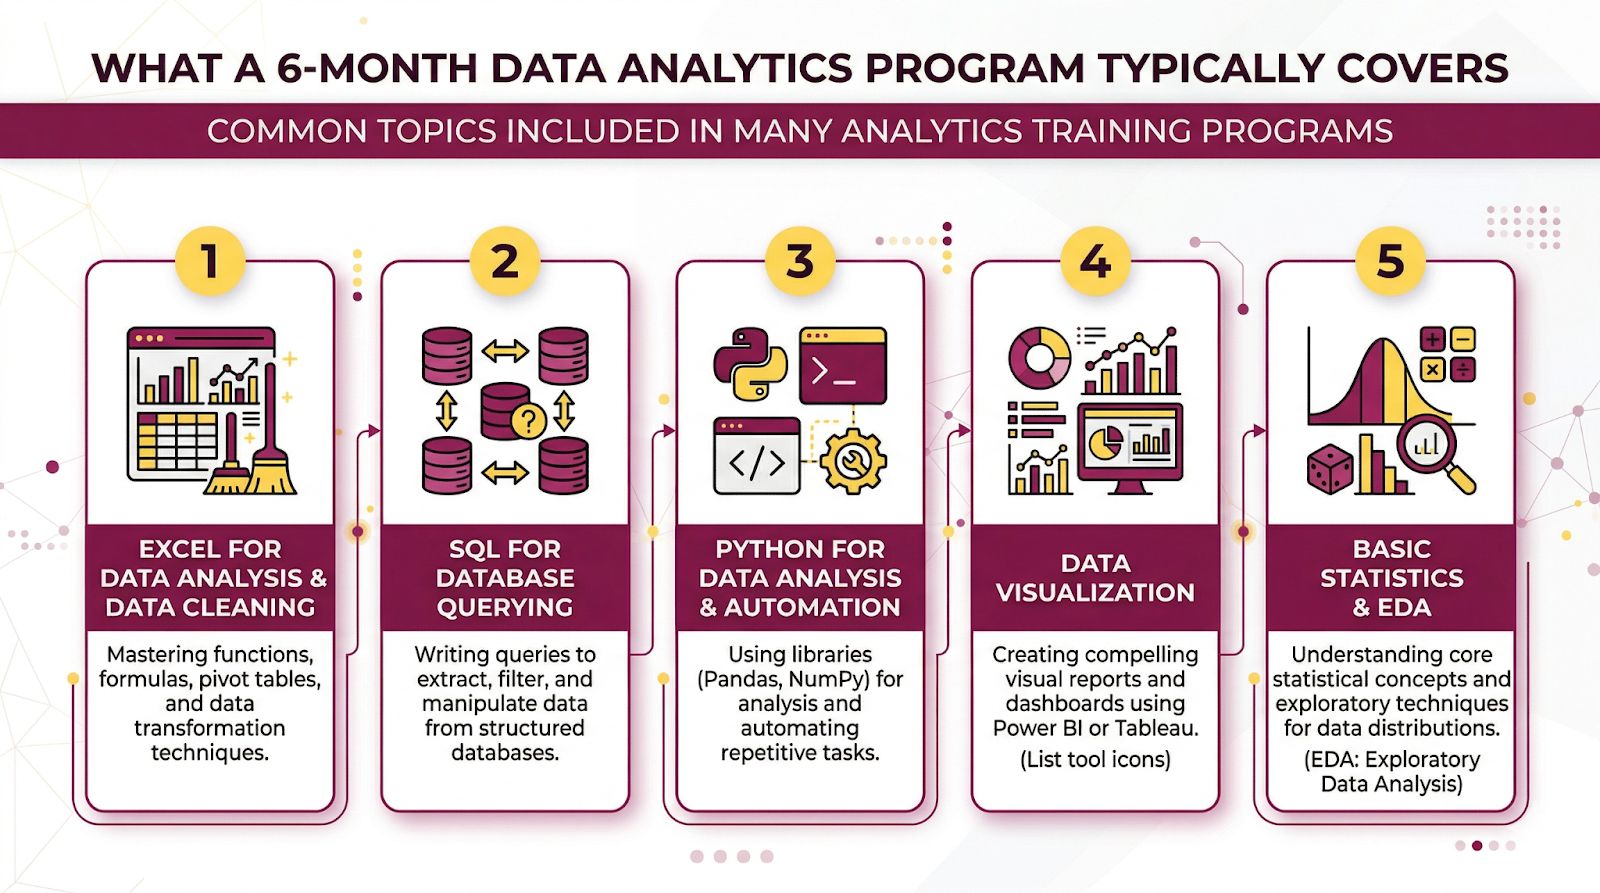
A well-structured data analytics program is designed to guide learners from basic data concepts to advanced analytical skills in a gradual and practical way. Instead of focusing only on theory, most programs divide the learning journey into stages where students first build foundational knowledge and then apply it through hands-on projects and real datasets.
Typically, the first part of the program introduces learners to data fundamentals, spreadsheet tools, and basic statistical concepts. As students progress, they begin learning database querying with SQL, programming for data analysis, and data visualization techniques. These skills form the foundation of most analytics careers and help learners understand how data is collected, processed, and interpreted in business environments.
Common topics included in many analytics training programs are:
- Excel for data analysis and data cleaning
- SQL for database querying and data extraction
- Python for data analysis and automation
- Data visualization using tools like Power BI or Tableau
- Basic statistics and exploratory data analysis
A typical analytics course overview explains how these topics are usually distributed across several months to ensure learners build confidence with each skill before moving to the next stage.
The following sections break down what students commonly learn during each phase of a six-month analytics learning journey.
Month 1 – Foundations of Data Analytics
The first month of a typical data analytics program focuses on building a strong foundation. Students are introduced to the core concepts of data analytics and learn how data is used to support decision-making in business environments. This stage helps beginners understand the role of a data analyst and the types of problems they solve using data.
One of the main tools introduced during this phase is Excel, which is widely used for data analysis in many organizations. Students learn how to organize datasets, perform basic calculations, and create simple charts to explore patterns in data. In addition to Excel, basic statistical concepts are introduced to help learners interpret numerical information correctly.
Key topics commonly covered in the first month include:
- Introduction to data analytics and business intelligence
- Data types and basic data handling techniques
- Excel functions and formulas for analysis
- Data cleaning and formatting techniques
- Basic statistics for understanding datasets
By the end of the first month, learners gain confidence in handling structured datasets and performing simple analyses. These skills serve as the foundation for more advanced tools and techniques introduced later in the program.
Month 2 – SQL and Database Fundamentals
In the second month, the focus shifts to databases and data retrieval. Most organizations store large volumes of business data in relational databases, and analysts need to extract relevant information before performing analysis. This stage of the data analytics program introduces SQL (Structured Query Language), which is one of the most important tools for data analysts.
Students learn how databases are structured and how tables store different types of information. They also begin writing SQL queries to retrieve, filter, and organize data from multiple tables. These skills allow analysts to access business data efficiently and prepare it for further analysis.
Key topics typically covered during this phase include:
- Introduction to relational databases
- Understanding tables, rows, and columns
- Writing basic SQL queries
- Filtering data using conditions
- Combining tables using joins
Through practice exercises and datasets, students learn how to extract insights from raw database records. These skills are essential because most analytics work begins with retrieving data from databases before applying statistical analysis or visualization techniques.
Month 3 – Python for Data Analysis
In the third month, learners begin working with Python, one of the most widely used programming languages in data analytics. Python allows analysts to process large datasets, automate repetitive tasks, and perform advanced analysis that goes beyond spreadsheet tools. At this stage of the data analytics program, students transition from basic data handling to more powerful analytical workflows.
The focus of this phase is on using Python libraries that simplify data analysis. Libraries such as Pandas and NumPy help analysts clean, transform, and explore datasets efficiently. Students also learn how to perform exploratory data analysis (EDA) to identify patterns, trends, and relationships within the data.
Topics commonly introduced during this stage include:
- Python basics for data analysis
- Working with Pandas for data manipulation
- Using NumPy for numerical operations
- Data cleaning and transformation techniques
- Exploratory data analysis using Python
By the end of this phase, learners gain the ability to handle larger datasets and perform deeper analysis using code. This skill is particularly valuable in professional environments where analysts often work with complex datasets that require automation and advanced data processing techniques.
Month 4 – Data Visualization and Business Intelligence Tools
In the fourth month, learners focus on transforming analytical results into clear and meaningful visual insights. While analyzing data is important, the ability to communicate findings effectively is equally critical. This phase of the data analytics program introduces visualization tools that help analysts present data in a way that decision-makers can easily understand.
Students learn how to build dashboards and interactive reports using business intelligence tools such as Power BI or Tableau. These tools allow analysts to combine multiple datasets, create charts, and design visual dashboards that highlight key trends and performance indicators.
Key topics covered during this stage include:
- Principles of data visualization
- Creating charts and graphs for data storytelling
- Building dashboards using Power BI or Tableau
- Designing reports that highlight key business metrics
- Presenting insights to non-technical stakeholders
Common Data Visualization Tools
| Tool | Primary Use |
|---|---|
| Power BI | Interactive business dashboards |
| Tableau | Advanced visual analytics |
| Excel Charts | Quick visual reporting |
By the end of this phase, learners understand how to turn raw analysis into visually engaging insights that support business decisions. This ability to communicate findings clearly is one of the most valuable skills for modern data analysts.
Month 5 – Real-World Analytics Projects
By the fifth month, learners begin applying everything they have learned through practical projects. This stage of a data analytics program focuses on solving real business problems using datasets that reflect industry scenarios. Instead of only practicing individual tools, students combine Excel, SQL, Python, and visualization tools to complete end-to-end analytics projects.
Project-based learning helps students understand how data analysis works in professional environments. They learn how to define a problem, explore datasets, perform analysis, and present insights that support business decisions. Many training programs introduce case studies related to marketing analytics, sales forecasting, customer behavior analysis, or operational performance.
Typical project activities during this phase include:
- Working with real datasets from business scenarios
- Cleaning and preparing data for analysis
- Performing exploratory data analysis
- Creating dashboards and reports
- Presenting insights and recommendations
Practical projects also help learners build portfolios that showcase their skills to potential employers. Guides on how to become a data analyst often emphasize the importance of project experience in preparing students for real analytics roles.
By the end of this stage, students gain confidence in applying analytics tools and techniques to solve real-world problems.
Month 6 – Portfolio Building and Career Preparation
The final stage of a data analytics program focuses on preparing learners for real job opportunities. By this time, students have already gained experience with analytics tools and completed practical projects. The last month is dedicated to organizing these projects into a professional portfolio and preparing for analytics interviews.
Building a strong portfolio is one of the most important steps for aspiring data analysts. Employers often review project work to evaluate how candidates approach data problems and present insights. During this phase, students refine their projects, improve documentation, and create clear explanations of their analysis process.
Key activities commonly included in this stage are:
- Organizing completed projects into a professional portfolio
- Writing clear project descriptions and insights
- Preparing resumes focused on analytics skills
- Practicing technical and case-study interview questions
- Learning how to present data-driven insights effectively
Many learners also explore additional resources to expand their knowledge of analytics and related fields. Accessing broader data science learning resources can help students understand how analytics connects with areas such as machine learning and advanced data science.
By the end of the sixth month, learners are typically ready to apply for entry-level analytics roles with both technical skills and practical project experience.
The final stage of a data analytics program focuses on preparing learners for real job opportunities. By this time, students have already gained experience with analytics tools and completed practical projects. The last month is dedicated to organizing these projects into a professional portfolio and preparing for analytics interviews.
Building a strong portfolio is one of the most important steps for aspiring data analysts. Employers often review project work to evaluate how candidates approach data problems and present insights. During this phase, students refine their projects, improve documentation, and create clear explanations of their analysis process.
Key activities commonly included in this stage are:
- Organizing completed projects into a professional portfolio
- Writing clear project descriptions and insights
- Preparing resumes focused on analytics skills
- Practicing technical and case-study interview questions
- Learning how to present data-driven insights effectively
Many learners also explore additional resources to expand their knowledge of analytics and related fields. Accessing broader data science learning resources can help students understand how analytics connects with areas such as machine learning and advanced data science.
By the end of the sixth month, learners are typically ready to apply for entry-level analytics roles with both technical skills and practical project experience.
Skills You Gain After a 6-Month Analytics Program
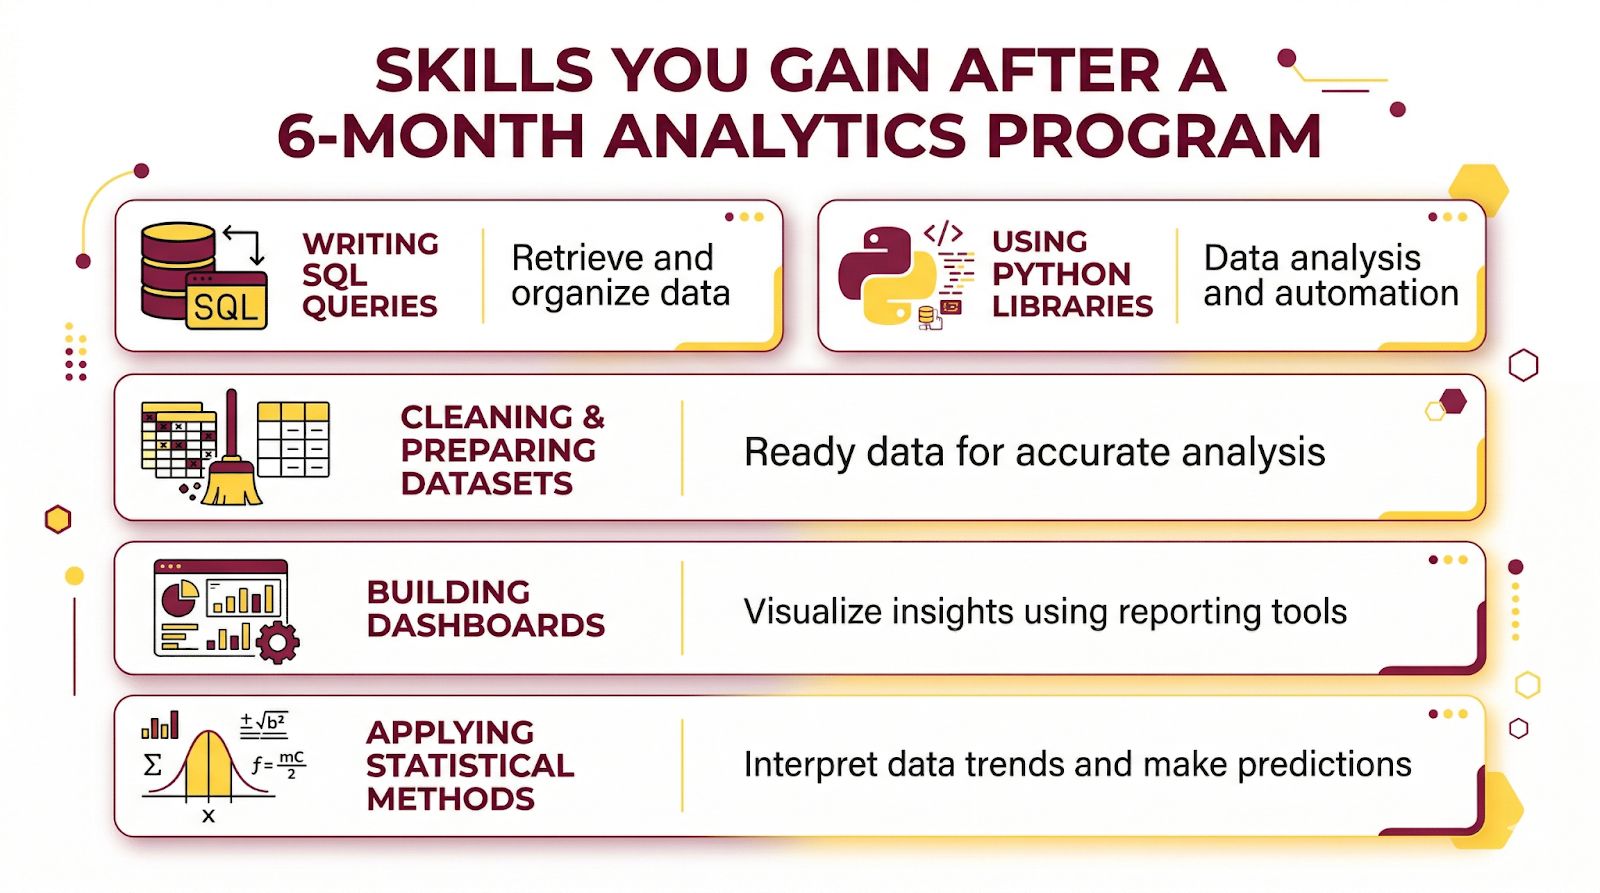
After completing a structured data analytics program, learners usually gain a combination of technical and analytical skills that are required in entry-level analytics roles. These skills come from working with multiple tools, analyzing datasets, and completing real-world projects throughout the training period.
Students learn how to collect, clean, and analyze data using different tools and techniques. They also develop the ability to interpret results and present insights clearly through reports or dashboards. These capabilities are essential for helping organizations understand trends, improve operations, and make data-driven decisions.
Some of the key skills developed during a six-month analytics program include:
- Writing SQL queries to retrieve and organize data
- Using Python libraries for data analysis and automation
- Cleaning and preparing datasets for analysis
- Building dashboards using visualization tools
- Applying statistical methods to interpret data
Skills Developed During a Data Analytics Program
| Skill | Practical Application |
|---|---|
| SQL Querying | Extracting and filtering business data |
| Python Data Analysis | Automating data processing tasks |
| Data Visualization | Creating dashboards and reports |
| Exploratory Data Analysis | Identifying patterns in datasets |
| Statistical Analysis | Supporting data-driven decisions |
These skills help learners transition from training programs into real analytics roles where they are expected to analyze data and communicate insights effectively.
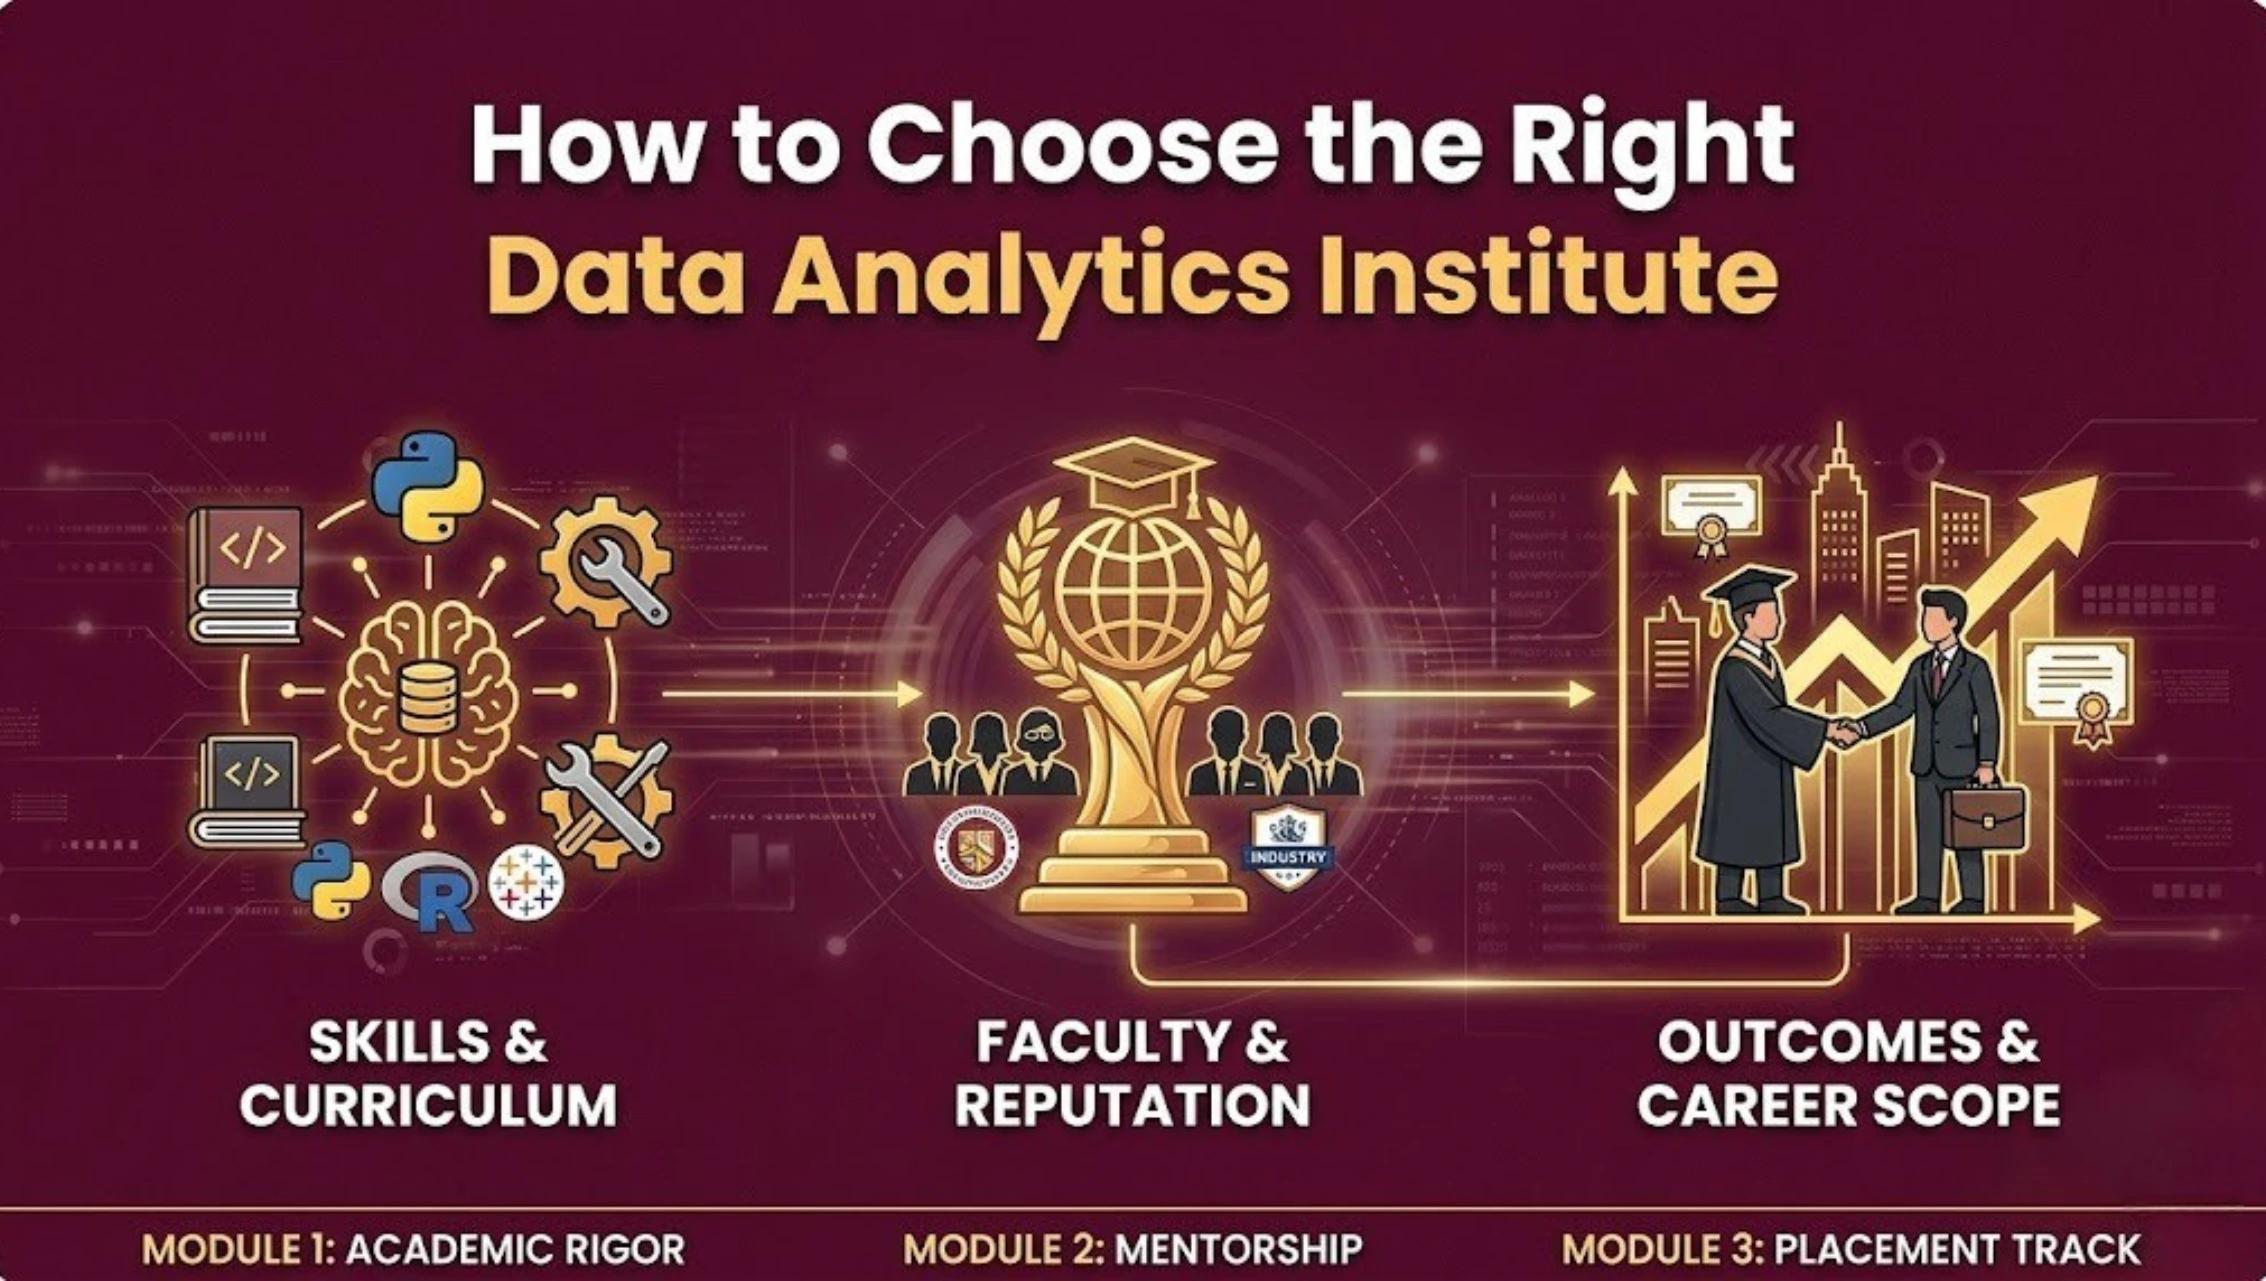
How to Choose the Right Data Analytics Program
Not every data analytics program offers the same level of practical learning and career preparation. While some programs focus mainly on theoretical concepts, others emphasize hands-on projects, industry tools, and portfolio development. Choosing the right training program can significantly influence how quickly a learner becomes job-ready.
A strong program should combine foundational knowledge with real-world applications. Instead of only teaching tools separately, the program should guide students through the entire analytics workflow—from data collection and cleaning to analysis and visualization. Programs that include case studies and practical datasets help learners understand how analytics is used in real business environments.
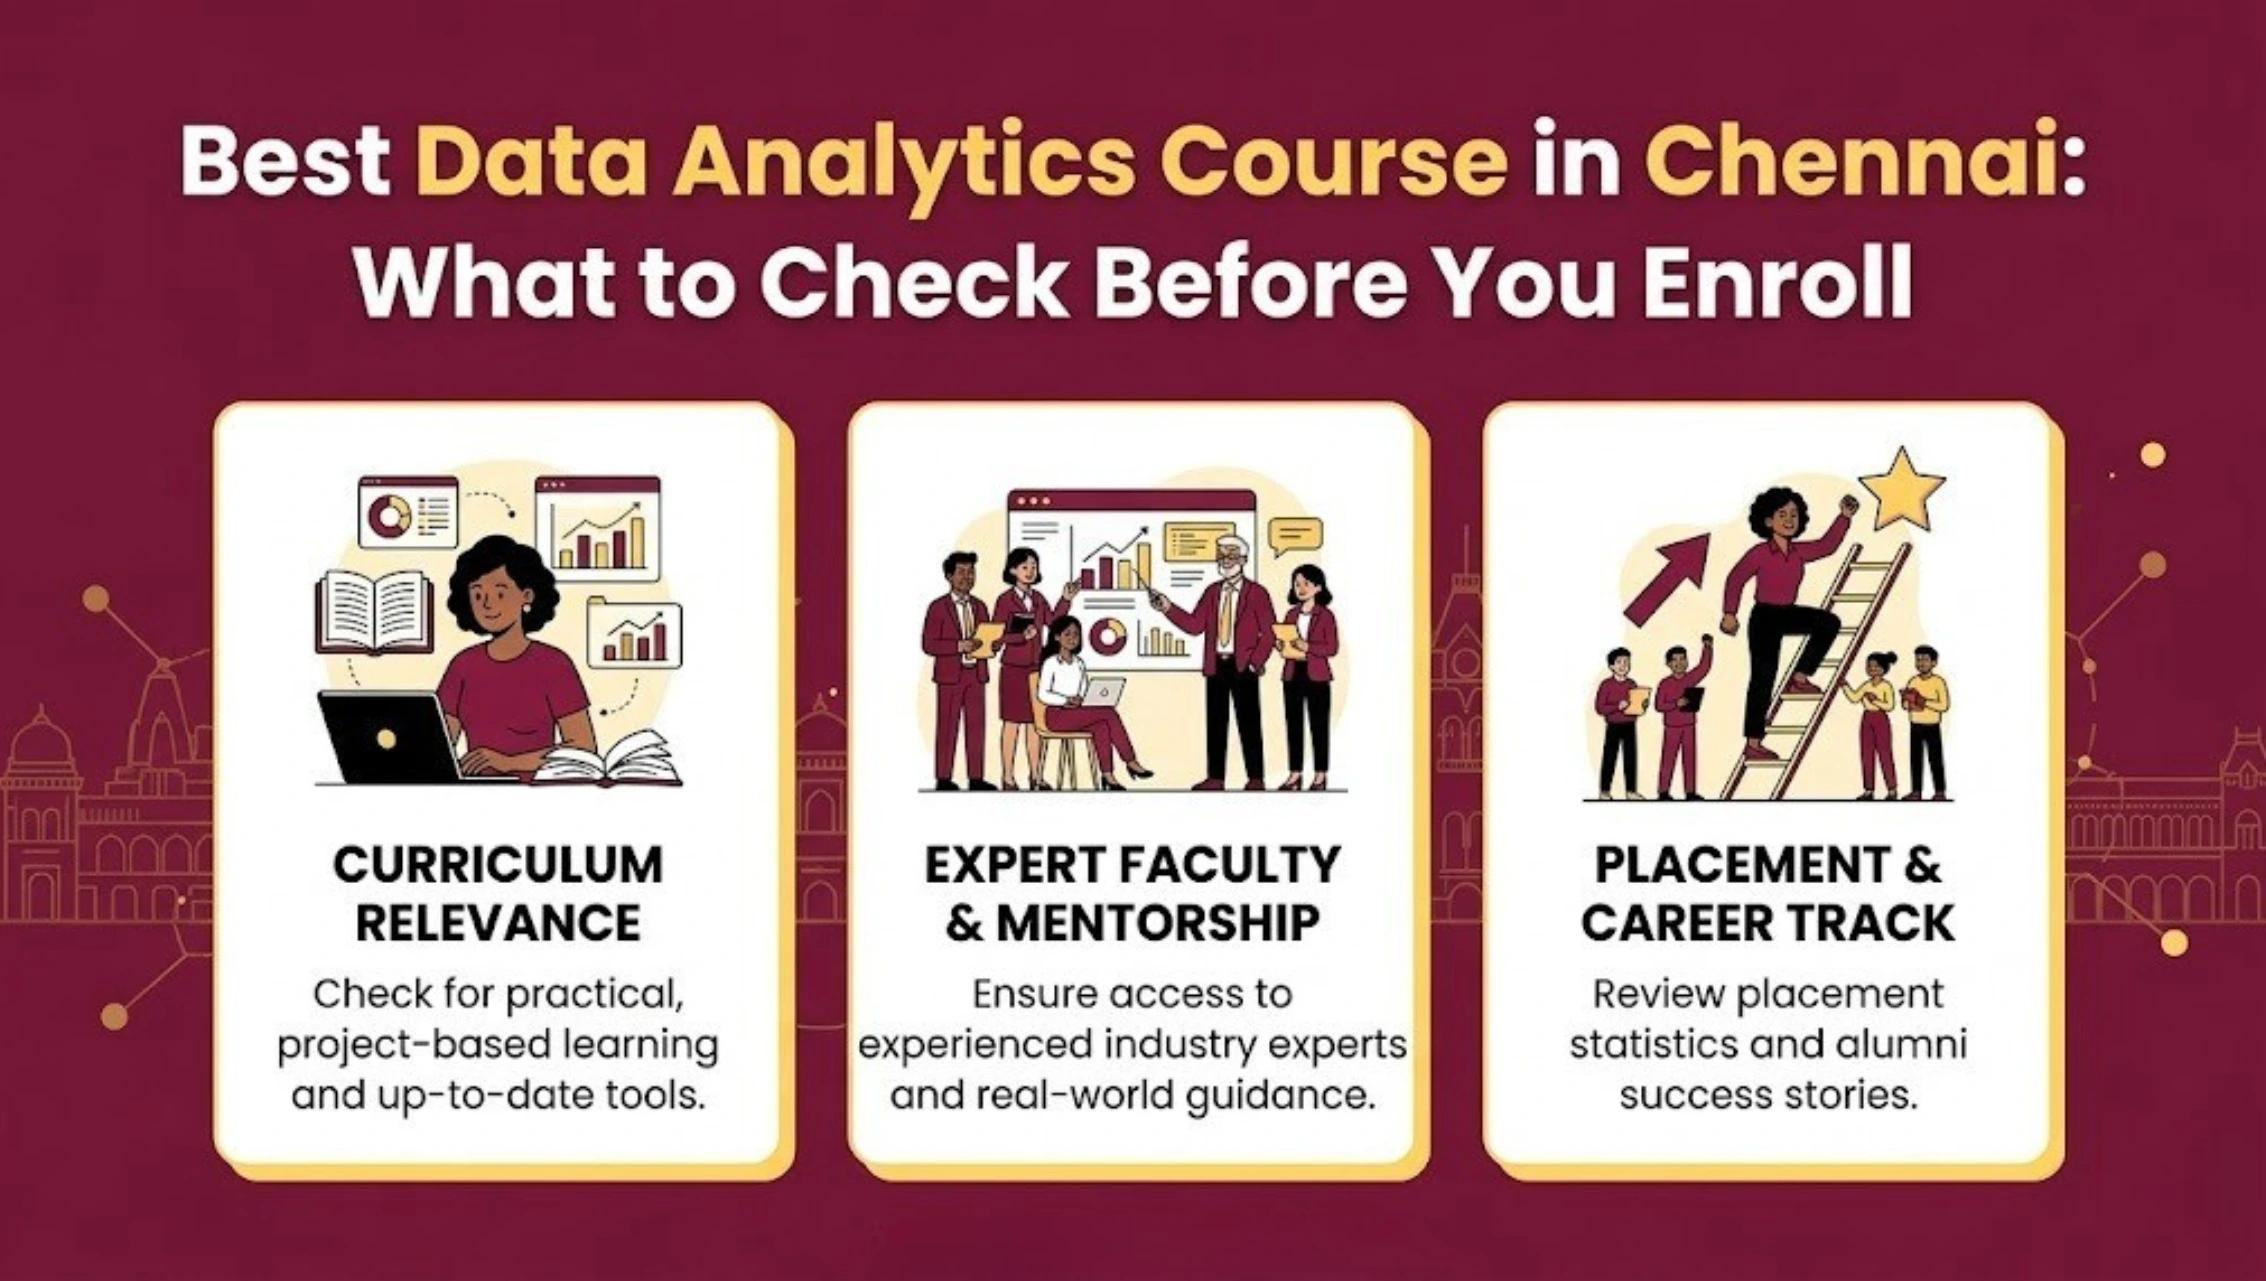
When evaluating different analytics programs, learners should consider the following factors:
- Whether the program includes real-world projects and datasets
- Coverage of essential tools such as Excel, SQL, Python, and visualization tools
- Opportunities to build a strong project portfolio
- Guidance for resume building and interview preparation
- Support from instructors or mentors with industry experience
Exploring additional learning materials and curated data science learning resources can also help students identify programs that emphasize practical skills and career readiness. Choosing a program that balances theory with hands-on training makes it easier for learners to transition into professional analytics roles.
Conclusion
A structured data analytics program can help learners build the skills required for entry-level analytics roles in a clear and progressive way. By spreading the learning journey across several months, students are able to develop foundational knowledge first and then gradually move toward more advanced tools and real-world applications.
Throughout a typical six-month learning path, students begin with basic data concepts and spreadsheet analysis, then progress to SQL, Python, and visualization tools. They eventually apply these skills through real projects and portfolio development. This step-by-step approach ensures that learners gain both technical knowledge and practical experience.
However, the most important aspect of any analytics training program is hands-on learning. Programs that include real datasets, industry tools, and project-based learning are far more effective in preparing students for professional roles. When learners focus on building projects and communicating insights, they develop the confidence needed to work with data in real business environments.
Choosing the right program with a clear curriculum, strong mentorship, and practical training can make a significant difference in building a successful analytics career.
Start Your Journey with Industry-Focused Training
If you want to build practical analytics skills and gain experience with real datasets, choosing the right data analytics program is an important first step. Programs that focus on hands-on projects, industry tools, and real business scenarios help learners develop the skills needed for modern analytics roles.
A well-designed training program typically includes tools such as Excel, SQL, Python, and visualization platforms while guiding students through real analytics workflows. This approach helps learners understand how data is collected, analyzed, and presented in professional environments.
To gain structured training and practical experience, you can explore the Certification in AI Powered Data Analytics.
For learners interested in advancing beyond analytics into machine learning and advanced data science concepts, the PG Certification in AI Powered Data Science provides additional opportunities to expand technical expertise:
With the right training program and consistent practice, learners can build strong analytics skills and prepare themselves for careers in data analytics and related fields.